
Learn the everything you need to know about hundreds of projects from throughout Australia. We’ve got the insider information to ensure that you choose the apartment, townhouse or house and land project that suits you and your lifestyle.
This is independent editorial content written by a PropertyMash Journalist. While we try to ensure all information is as accurate as possible, please double check with the developer or real estate agent directly before making a purchasing decision. The information contained within this article may be incorrect or out of date.
Owner occupiers have been the primary driver of the housing market rebound, comprising 76 per cent of all new home loans during the 12 months to March, 2021.
This compares to the decade average where owner occupiers have made up 65 per cent of demand; but the mix of housing activity is starting to change as investors become more active.
The past six months has seen the value of investor loans increase by 48.1 per cent while the value of owner occupier loans is up a smaller 29.7 per cent.
The March quarter alone saw the value of investment lending for housing surge by 28.7 per cent while the value of new owner occupier home loans was up a much smaller 12.4 per cent.
On an annual basis, the growth in the value of owner occupier lending (+55.6 per cent) is now roughly on par with the lift in investor loans (54.3 per cent) as investors play catch-up.
Despite the rise in investor lending, investment loans comprised only 25.9 per cent of the value of new mortgage commitments in March, up from a recent record low of just 23.1 per cent in January this year, but well down on the decade average and the historical highs recorded in 2015.
Historically, the share of investor activity peaked at 45.9 per cent, soon after macroprudential measures were announced by APRA in December, 2014.
The 2014 measures placed a 10 per cent speed limit on investment credit growth.
Although the share of investor lending staged a temporary bounce back in 2016, investor activity turned due to a second round of credit tightening in 2017, which focused on reducing interest only lending.
Coupled with a more cautious lending environment during and after the Royal Commission, the share of investors in the market trended consistently lower until February this year.

Investor activity remains below average across every state and territory, ranging from just 13.3 per cent of mortgage demand in the Northern Territory to 31.5 per cent of demand across New South Wales.
The loan commitments data shows investor demand remains concentrated in NSW with most of this activity likely to be concentrated within the Sydney region.
NSW has historically attracted the largest share of investors, with this group of buyers averaging 41.4 per cent of mortgage demand during the past 10 years and in March 2021, NSW was the only state where investors comprised more than 30 per cent of mortgage demand.

The concentration of investors in NSW may seem a little counter intuitive.
Sydney is the most expensive capital city by some margin, implying the financial commitment is more significant than other regions.
It also has the lowest rental yields, signalling some imbalance between housing values and rental rates.
Where Sydney stands out is capital gains; Sydney has the highest average annual rate of capital gains during the past decade with house values averaging a 6.6 per cent rise each year and unit values averaging 4.5 per cent per annum.
With most investors focused on capital gain rather than rental return, this track record of growth might help to explain the popularity of Sydney among investors.
During the past 12 months, Darwin has recorded the most significant rate of capital gain, with house values up 18.2 per cent.
Regional Tasmania (17.8 per cent) and regional NSW (16.3 per cent) come in a close second and third.
Across the unit market, the swiftest rise in values has been in regional Victoria (13.6 per cent) and Hobart (11.6 per cent).
For investors more focused on cashflow opportunities, the higher yielding markets may be more attractive.
The highest capital city gross rental yields can be found in Darwin (5.6 per cent), Hobart (4.4 per cent) and Perth (4.3 per cent) for houses, while gross yields for units are highest in Darwin (7.2 per cent), Canberra (5.5 per cent) and Perth (5.4 per cent).
Yields are generally higher across regional markets, with regional Northern Territory (6.3 per cent) and regional Western Australia (5.9 per cent) recording the highest gross yields for houses. Regional WA also stood out with the highest gross yield for units at 8 per cent.
The total return, which provides a measure of the annual capital gain plus annualised gross rental return, highlighted the areas that have provided the best overall investment returns.
During the past 12 months, regional Tasmania (24.5 per cent) and Darwin (24.4 per cent) have provided the highest total returns for houses among the broad regions of Australia.
For units, the strongest overall returns during the past year have been in regional Victoria (19.3 per cent) and regional Queensland (16.9 per cent).

Of course, past performance is not a guarantee of future performance. In fact, the best investment options may be those markets that have underperformed over previous cycles, providing a more affordable environment and generally higher rental yields.
Demographic factors, which have changed significantly during the past 12 months, will also play a role.
Overseas migration is set to remain low for at least the next year, implying regions with strong interstate and internal migration rates will have a higher level of housing demand.
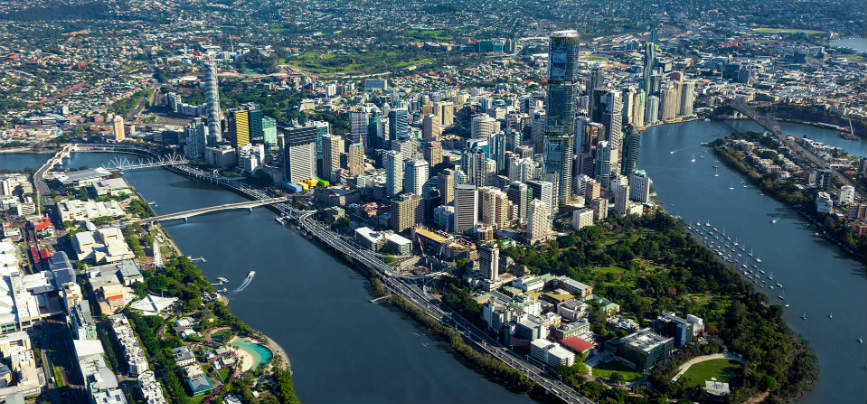
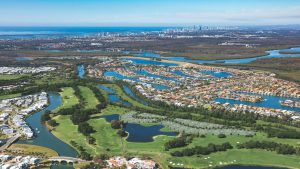
South-east Queensland, Perth and regional areas of Victoria and NSW are all showing a positive demographic trend.
Economic conditions are also important. Regions with a diverse economic base are likely to show less risk relative to areas with shallow economies.
Trends in jobs growth, employment rates and capital investment such as significant infrastructure spending are also critical for picking areas ripe for investment.
We would love to hear your thoughts on this project.
Have you visited this project recently, or perhaps you live nearby or bought in a neighbouring building? Tell us what you love about this project, or perhaps what you don't.