
Leading property agency JLL has released some indepth analysis yesterday analysing the Brisbane, Sydney and Melbourne apartment markets which is well worth a read. You can find the articles here.
We all often see commentary on specific markets, and much rumor and speculation about specific markets, but we thought we would dig into this report and compare some numbers between the 3 markets.
If you look at any property related commentary at the moment you would think of these three markets in this way:
Brisbane – ‘stinks’
Sydney – ‘hot hot hot’
Melbourne – ‘hot’
So looking at the JLL research, what do the numbers say?
Median Price is a great place to start.
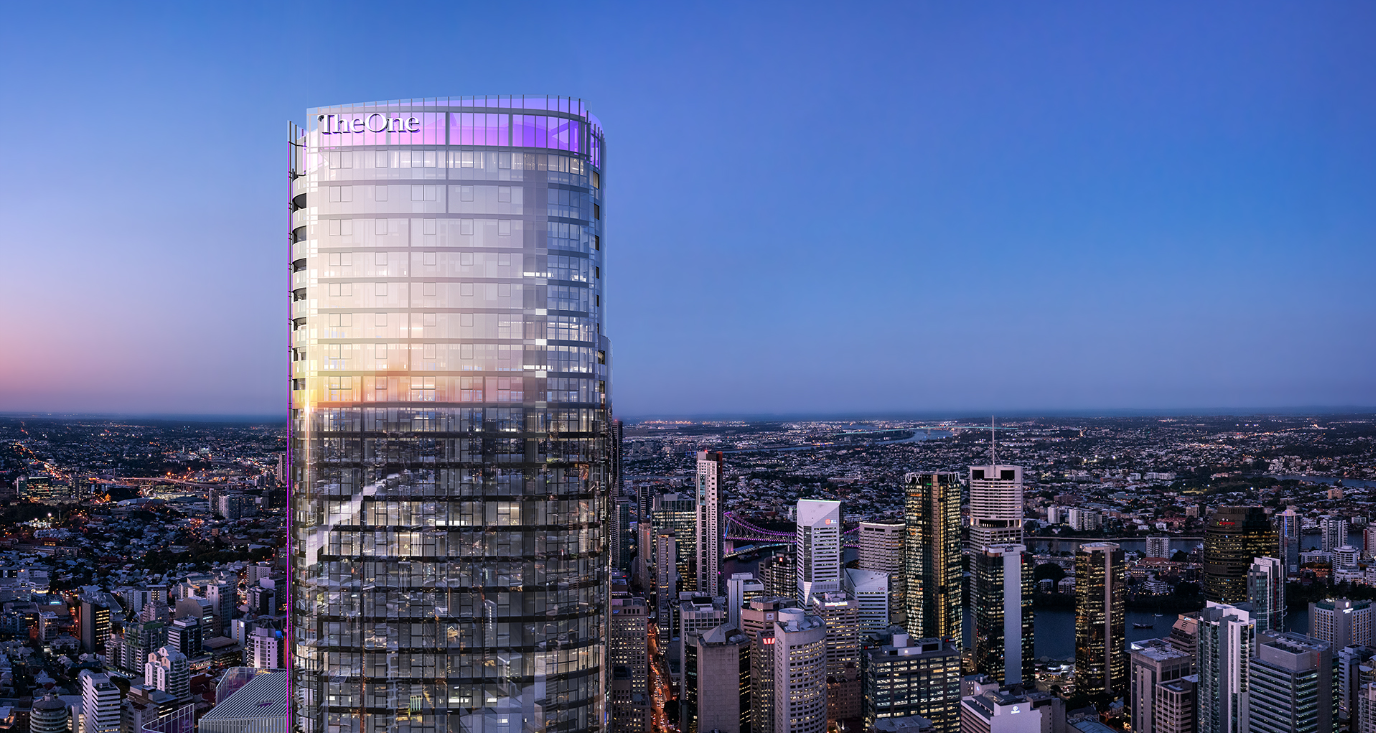
Brisbane – $410,000
Sydney – $691,000
Melbourne – $485,850
Of course prices in themselves don’t tell us anything in particular. So lets look at the comparative gross rental returns:
Brisbane – 4.88%
Sydney – 3.9%
Melbourne – 4.07%
Price growth + gross rental return shows us our net return on an investment of course:
Brisbane – -2.4%
Sydney – 3.9%
Melbourne – 0.2%
The figures that really tell you the state of the markets relative to each other however are the completed and currently being marketed apartments, as a percentage of annual sales volume.
The JLL report states that 76% of all completed apartments in Brisbane have been sold. Unfortunately they don’t state similar figures for the Sydney and Melbourne market. For the sake of this process lets assume a similar 75% pre-sales rate on all completed projetcs, and a 0% pre-sold rate on currently marketed projects. This will show a currently available apartment supply rate of:
Brisbane – 8,650
Sydney – 10, 415
Melbourne – 19,615
We now need to look at the annual sales rate, which JLL does include. Below we have shown the annual sales rate, and the number of months of supply that the above currently available apartments represent.
Brisbane – 4,321 (24 months supply in the market)
Sydney – 37,300 (3 months supply in the market)
Melbourne – 27,655 (8 to 9 months supply in the market)
If you are a believer in supply and demand being the true drivers of the value of any product, you would think that these figures should give you some indication of where capital prices in the 3 markets will be moving in the next 2 years.
But here is the catch! We are not operating in a perfect market. 24 months of stock in Brisbane = a very touch market. This means that in the Brisbane market, there are a number of distressed developers who must sell built product due to funding and cashflow pressures. For smart counter cyclical investors this means that there are some fantastic value buys in the Brisbane market at the moment. You will have the opportunity to purchase below market, which will provide a better long term capital gain whilst also providing far better immediate gross rental returns. The strength of the Sydney and Melbourne markets means that you will not find any special deals there.
So the question is for an investor:
Everyone is fearful of the Brisbane market at the moment, and very greedy in the Sydney and Melbourne market so maybe it is time to look for some value!
[table id=1 /]


We would love to hear your thoughts on this project.
Have you visited this project recently, or perhaps you live nearby or bought in a neighbouring building? Tell us what you love about this project, or perhaps what you don't.